Contour Map Plot
I plotted the SVG contour map that I made in the previous post onto paper using my AxiDraw.
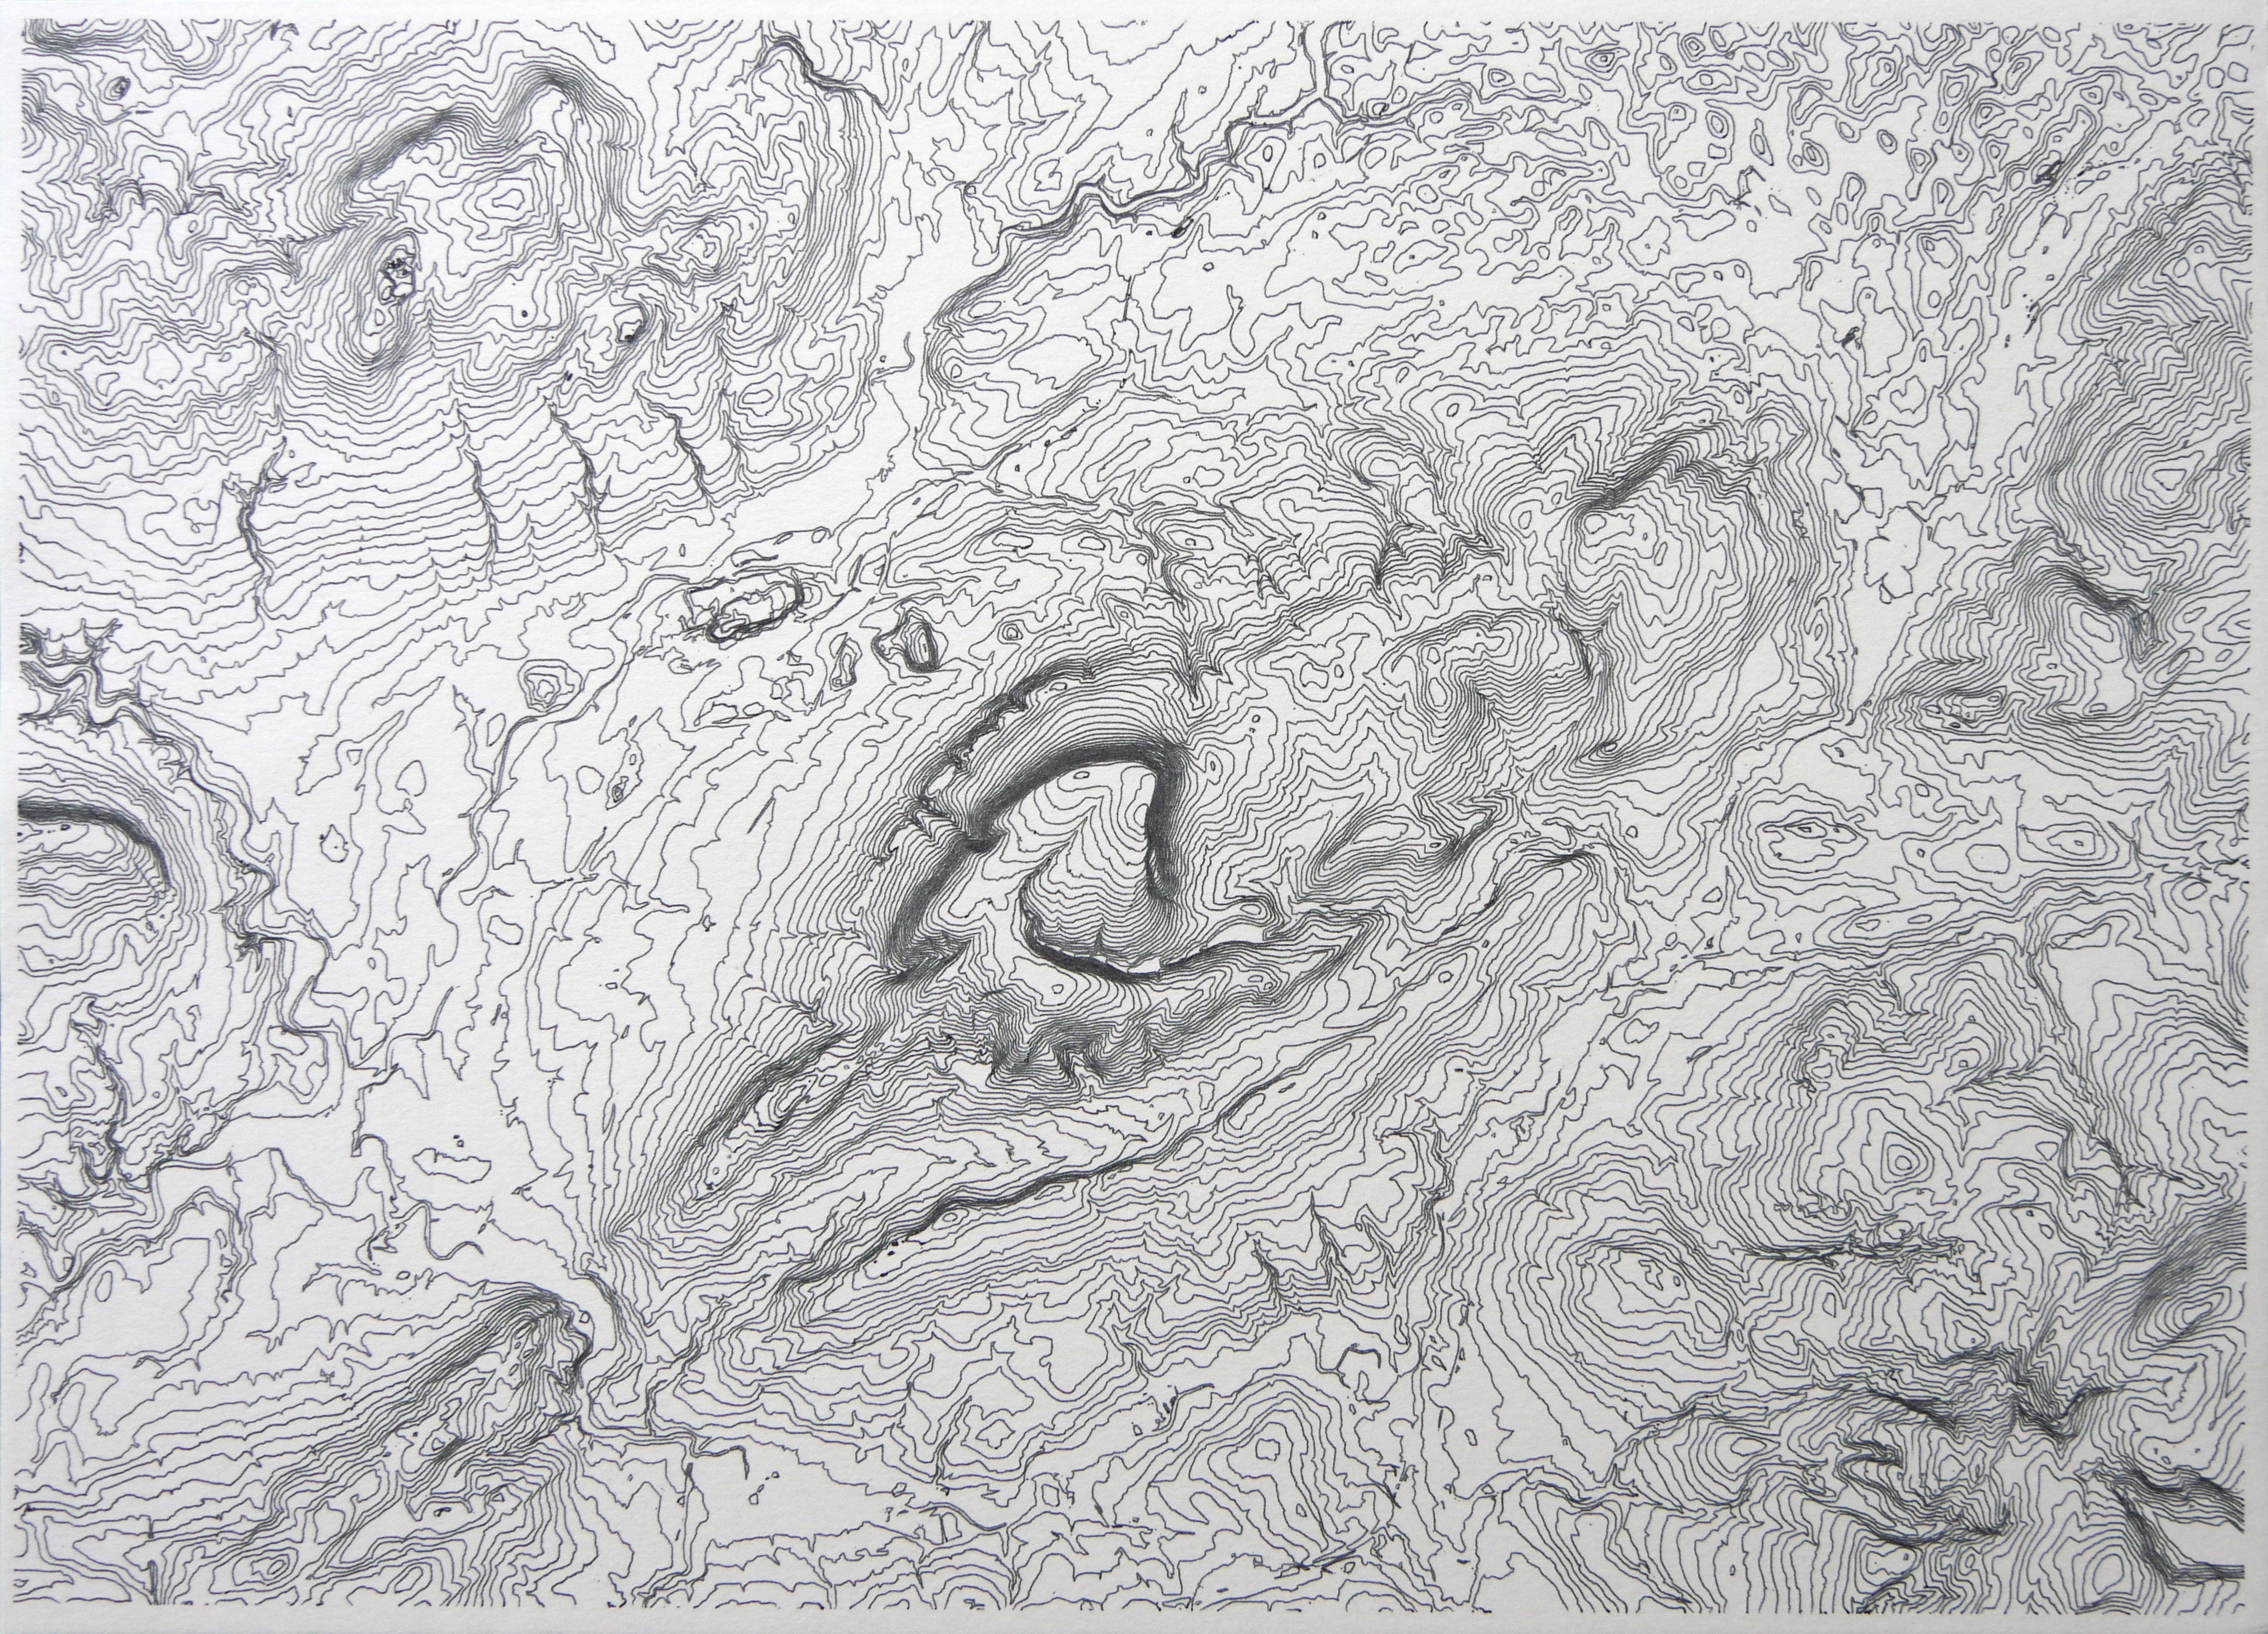
I used this Axidraw Python Library to do the plotting. Handily, the library supports loading paths from GeoJSON, so I could just give it the contour GeoJSON from last time.
import axi
import sys
import textwrap
import json
from shapely.geometry import shape

def main():
    js = json.load(open('./contours-simplified.geojson'))
    paths = []
    for f in js["features"]:
        for p in  axi.shapely_to_paths(shape(f["geometry"])):
            paths.append(p)
    d = axi.Drawing(paths)
    d = d.rotate_and_scale_to_fit(11.69, 8.27, padding=0.1)
    d = d.sort_paths()
    d.dump_svg('out.svg')
    axi.draw(d)

if __name__ == '__main__':
    main()